Understanding the relationships between assets is vital for success in financial markets. This is where the Pearson Correlation Indicator comes into play. This powerful statistical tool can help you improve your trading strategies, reduce your risk, and make smarter investment decisions.
What is the Pearson Correlation Indicator?
The Pearson Correlation Indicator is a trading tool that measures the linear relationship between two assets. This indicator calculates a coefficient (r) that ranges from +1 to -1:
- +1: Assets move perfectly together (positive correlation)
- -1: Assets move in completely opposite directions (negative correlation)
- 0: No clear relationship exists between the assets
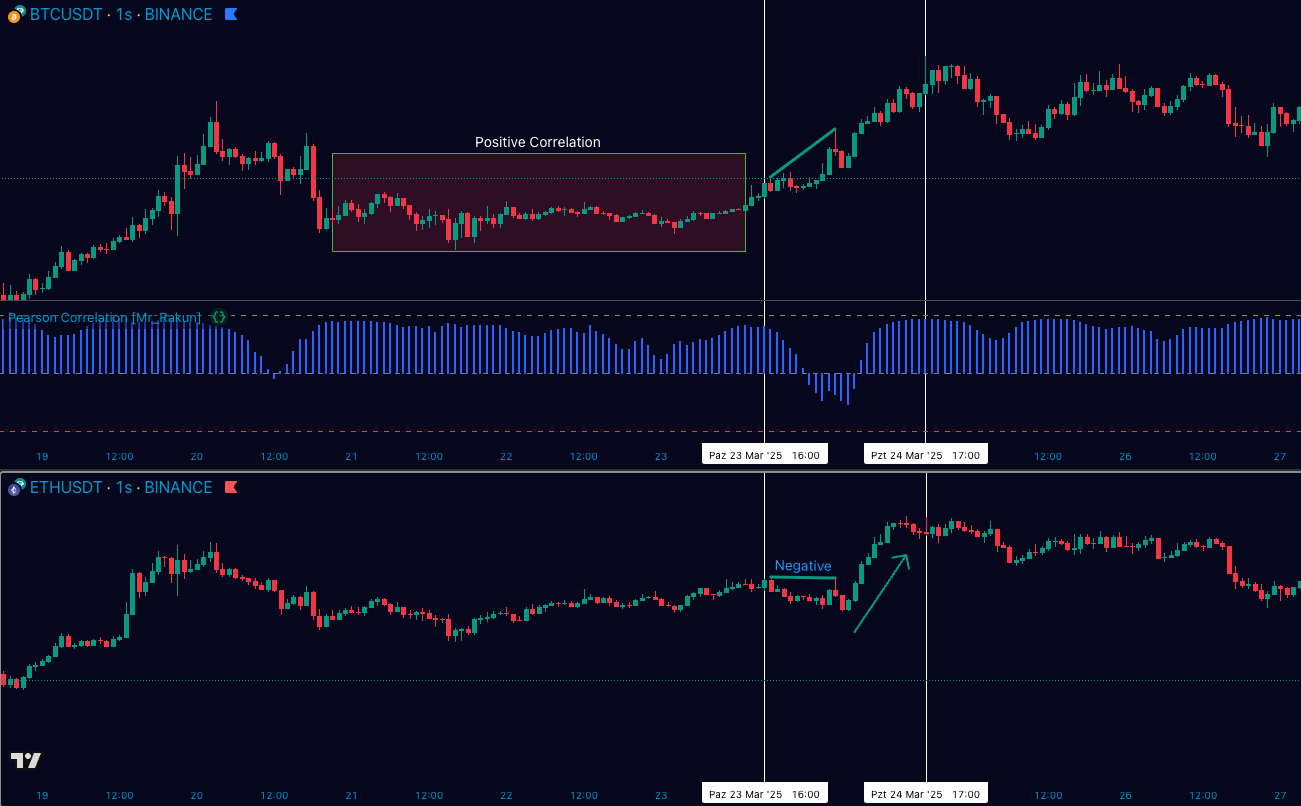
This indicator is often visualized as a histogram: green for positive correlation, red for negative correlation, and gray for no correlation. This visualization makes the indicator easy to interpret.
How Does It Work in Trading?
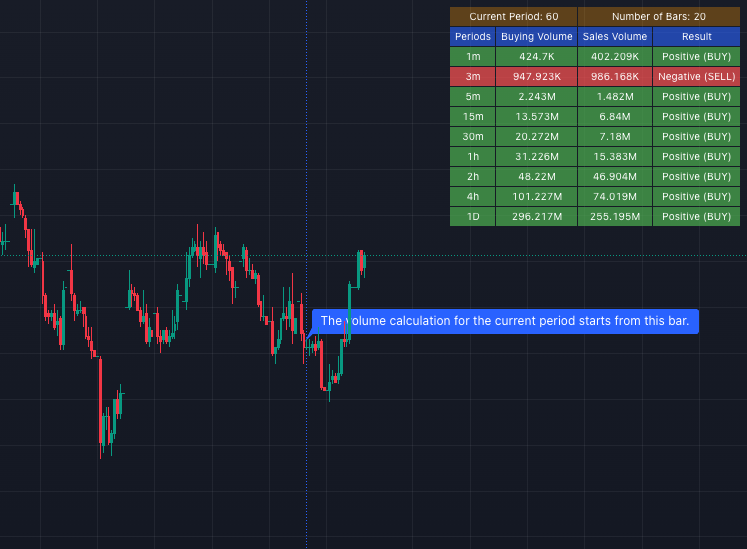
The Pearson Correlation Indicator uses a mathematical formula to analyze historical price data. It typically evaluates a default period of 20 bars. For example, you can compare the relationship between Bitcoin (BTC) and Ethereum (ETH).
The formula used is:
r = (n(∑xy) - (∑x)(∑y)) / √([n∑x² - (∑x)²][n∑y² - (∑y)²])
Where:
- n: the number of observations (typically 20 periods)
- x and y: the closing prices of the two assets being compared
This calculation shows investors how assets move together, which is critical for strategies like hedging or diversification.
Practical Benefits
Portfolio Diversification
The Pearson Correlation Indicator helps with portfolio diversification by identifying assets that don’t move together. By adding assets with low or negative correlation to your portfolio, you can reduce your overall risk.
For instance, if equities show a high positive correlation with each other, adding bonds with a lower correlation can stabilize returns.
Hedging Strategies
This indicator allows you to pair correlated assets to offset potential losses. For example, if there’s a negative correlation between BTC and ETH, you might invest in both to balance risk.
If one asset declines in value, the other asset with negative correlation might gain value, thus balancing your portfolio.
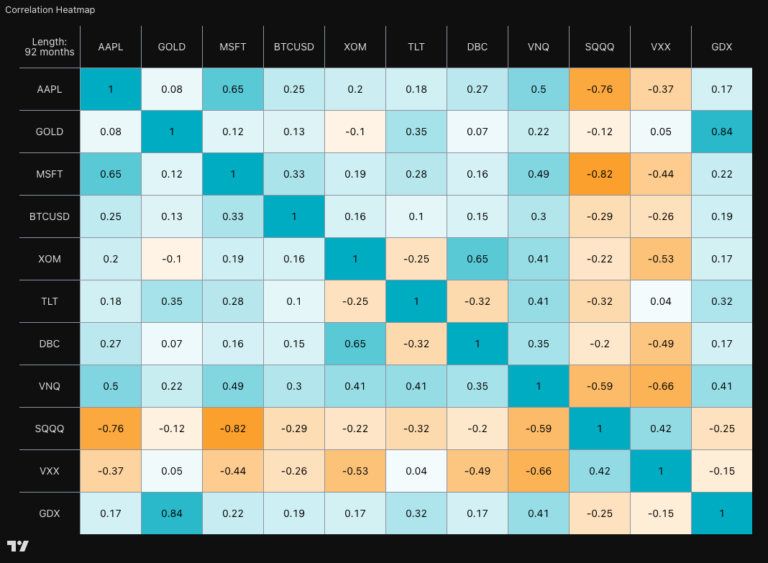
Market Comparisons
The Pearson Correlation Indicator facilitates the analysis of inter-market relationships, such as comparing large-cap equities with small-cap equities or debt with emerging market equities.
BTC and ETH Correlation: A Practical Example
As a real-world example, one study examined the correlation between BTC and ETH. In one scenario, while BTC was making higher highs, ETH failed to break its previous high within a 20-bar period, resulting in a negative correlation.
This divergence suggests ETH was not following BTC’s upward trend, which could indicate a trading opportunity. If BTC and ETH typically have a positive correlation, traders might expect ETH to rise, aligning with BTC, especially if market conditions are favorable (e.g., money flow, confirmed by the Money Flow Index or MFI).
Advantages and Limitations
The Pearson Correlation Indicator has significant advantages:
- It enhances risk management by highlighting diversification opportunities
- It supports hedging to mitigate losses in volatile markets
- It provides a data-driven approach to market analysis
However, it’s important to note a key limitation: the Pearson coefficient shows correlation, not causation. This means a high correlation between two assets doesn’t imply one causes the other’s movement. This is a critical distinction for investors to understand.
Conclusion
The Pearson Correlation Indicator is essential for traders aiming to enhance their strategies through asset correlation analysis. By leveraging this indicator, you can improve hedging strategies and achieve better portfolio diversification, ultimately boosting your trading success.
This tool is particularly valuable for its applicability to both traditional assets like stocks and bonds, and cryptocurrencies such as Bitcoin and Ethereum. This versatility makes it a valuable addition for any type of investor.
For more comprehensive insights, you can explore resources like Investopedia’s guide on correlation, which offers further reading on statistical measures in finance.