The Critical Role of Volume Analysis in Trading Strategies
Volume analysis is one of the cornerstones of a successful trading strategy. Correctly interpreting buying and selling pressure in the market is crucial for predicting price movements and determining appropriate entry and exit points. The “Volume Analysis Table MTF – Buy vs Sell Indicator,” developed by Mr_Rakun on the TradingView platform, is a powerful tool designed to meet exactly this need.
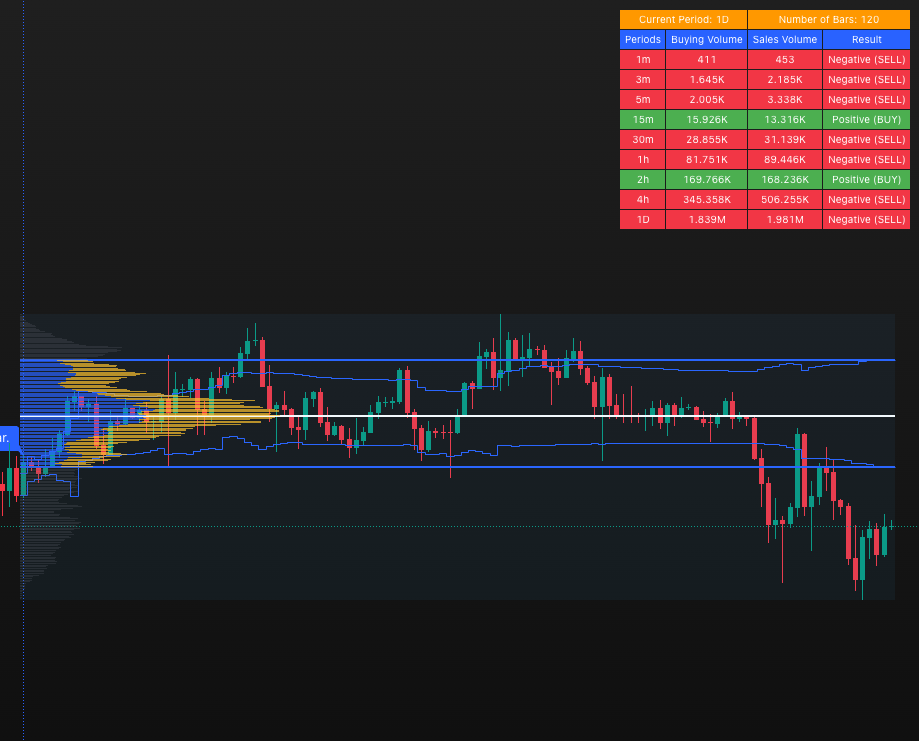
This indicator analyzes volume activities across different timeframes, allowing you to clearly distinguish between buying and selling volume. This enables you to quickly and effectively assess market sentiment and make more informed trading decisions.
What is the Volume Analysis Table MTF Indicator?
The “Volume Analysis Table MTF – Buy vs Sell Indicator” is a specialized indicator on the TradingView platform that simplifies volume analysis and visualizes buying and selling volume across multiple timeframes. Supporting a wide range of timeframes from 1 minute to 1 month, it provides valuable information for both short-term and long-term traders.
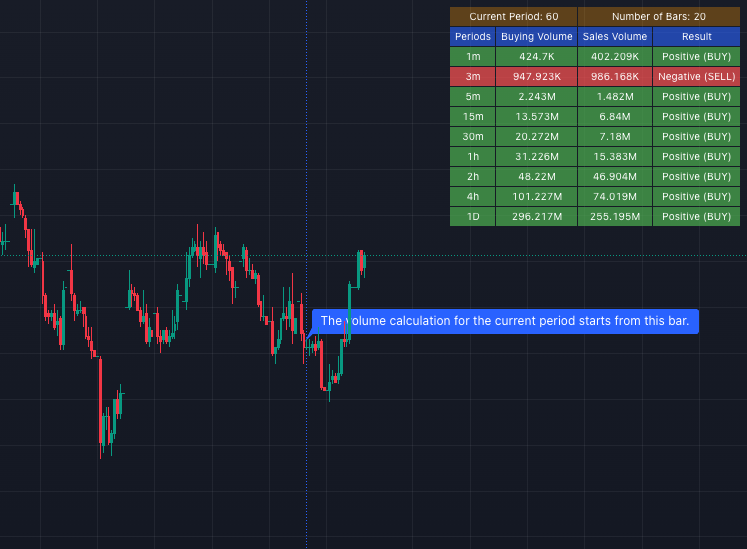
The indicator uses a simple but effective logic when analyzing volume data: If the closing price is higher than the opening price, the associated volume is classified as “buying volume”; if lower, it’s classified as “selling volume.” This distinction is visualized through color coding, allowing you to quickly analyze market pressure.
Key Features of the Indicator
| Feature | Description |
|---|---|
| Multi-Timeframe Analysis | Examines volume trends across different timeframes from 1 minute to 1 month |
| Buy-Sell Volume Distinction | Shows volume with color codes according to price movements |
| Customizable Table | Adjustable number of bars to analyze, timeframes to display, and table position |
| Weekly and Monthly Period Support | Provides additional data for long-term analysis (requires activation) |
The indicator particularly simplifies volume analysis for beginning traders, making complex data sets more accessible and accelerating the learning process.
How to Use It
Using the “Volume Analysis Table MTF – Buy vs Sell Indicator” on TradingView is quite simple:
- Log in to your TradingView account
- Search for “Volume Analysis Table MTF – Buy vs Sell Indicator” in the indicators library
- Add the indicator to your chart
- Customize your table from the settings menu:
- Determine the number of bars to analyze
- Select the timeframes to display
- Adjust the position of the table on the chart
- Enable weekly and monthly data (for long-term analysis)
By following these simple steps, you can quickly start using the indicator and integrate volume analysis into your trading strategy.
Benefits for Traders
The “Volume Analysis Table MTF – Buy vs Sell Indicator” offers various advantages to enhance your trading strategy:
1. Confirming Trend Strength
By analyzing volume data across different timeframes, you can confirm the strength of the current trend. For example, an uptrend supported by strong buying volume indicates the sustainability of the trend. Conversely, an uptrend with decreasing buying volume signals that the trend is weakening and could potentially reverse.
2. Determining Entry and Exit Points
The indicator helps you detect changes in market sentiment, making it easier to determine appropriate entry and exit points. For instance, after a price movement approaching a support level, an increase in buying volume in short-term timeframes may present a potential entry opportunity.
3. Understanding Market Sentiment
Volume data across multiple timeframes provides valuable information about the sentiment of market participants. For example, seeing high selling volume in short-term timeframes while buying volume dominates in long-term timeframes suggests that the market may experience a short-term correction, but the long-term uptrend could continue.
4. Breakout Confirmation
The indicator is particularly useful for validating breakouts at important support and resistance levels. During a breakout, increasing volume across multiple timeframes indicates that the breakout is strong and sustainable.
Practical Application Examples
Let’s examine two example scenarios to better understand the use of the indicator:
Scenario 1: Confirming Trend Strength
A stock has been in an uptrend for several days. Looking at the Volume Analysis Table MTF indicator, you notice strong buying volume in the 1-hour timeframe, but you observe that buying volume is decreasing in the daily timeframe. This situation indicates that the short-term uptrend is continuing, but the long-term trend may be weakening. Based on this information, you can continue to maintain your position, but be prepared for a potential trend reversal.
Scenario 2: Confirming Resistance Breakout
A cryptocurrency breaks an important resistance level it has been testing for a long time. Looking at the Volume Analysis Table MTF indicator, you see increasing buying volume in the 15-minute, 1-hour, and daily timeframes. This situation shows that the breakout is strong and sustainable, therefore potentially offering a suitable opportunity to open a position in the direction of the trend continuation.
Strengthen Your Trading Strategy with Volume Analysis
The “Volume Analysis Table MTF – Buy vs Sell Indicator” is a powerful tool that presents volume analysis across multiple timeframes, helping traders better understand market sentiment and make more informed trading decisions. The customizable structure of the indicator is suitable for both beginning and experienced traders.
Volume analysis plays a critical role in interpreting price movements and predicting potential trend reversals. This indicator simplifies complex volume data, accelerating traders’ decision-making processes and increasing the effectiveness of their trading strategies.
By using the “Volume Analysis Table MTF – Buy vs Sell Indicator” on the TradingView platform, you can integrate volume analysis into your trading strategy and better understand market sentiment across different timeframes.
Note: This information is for educational purposes only and does not constitute financial advice. Always do your own research when trading and consult with a professional before making financial decisions.